我们自己抓的数据,和一个推荐系统模拟
这一页是小组报告的附录。所有数字都是我们自己采集或生成的,不是引用别人的结论。 下面会写清楚:哪些是真实抓到的数据,哪些是模拟出来的。
Appendix to our MM544 group report. Everything here is data we collected or generated ourselves. The provenance of each number — real or simulated — is stated explicitly below.
数据来源说明:哪些是真的,哪些是模拟的
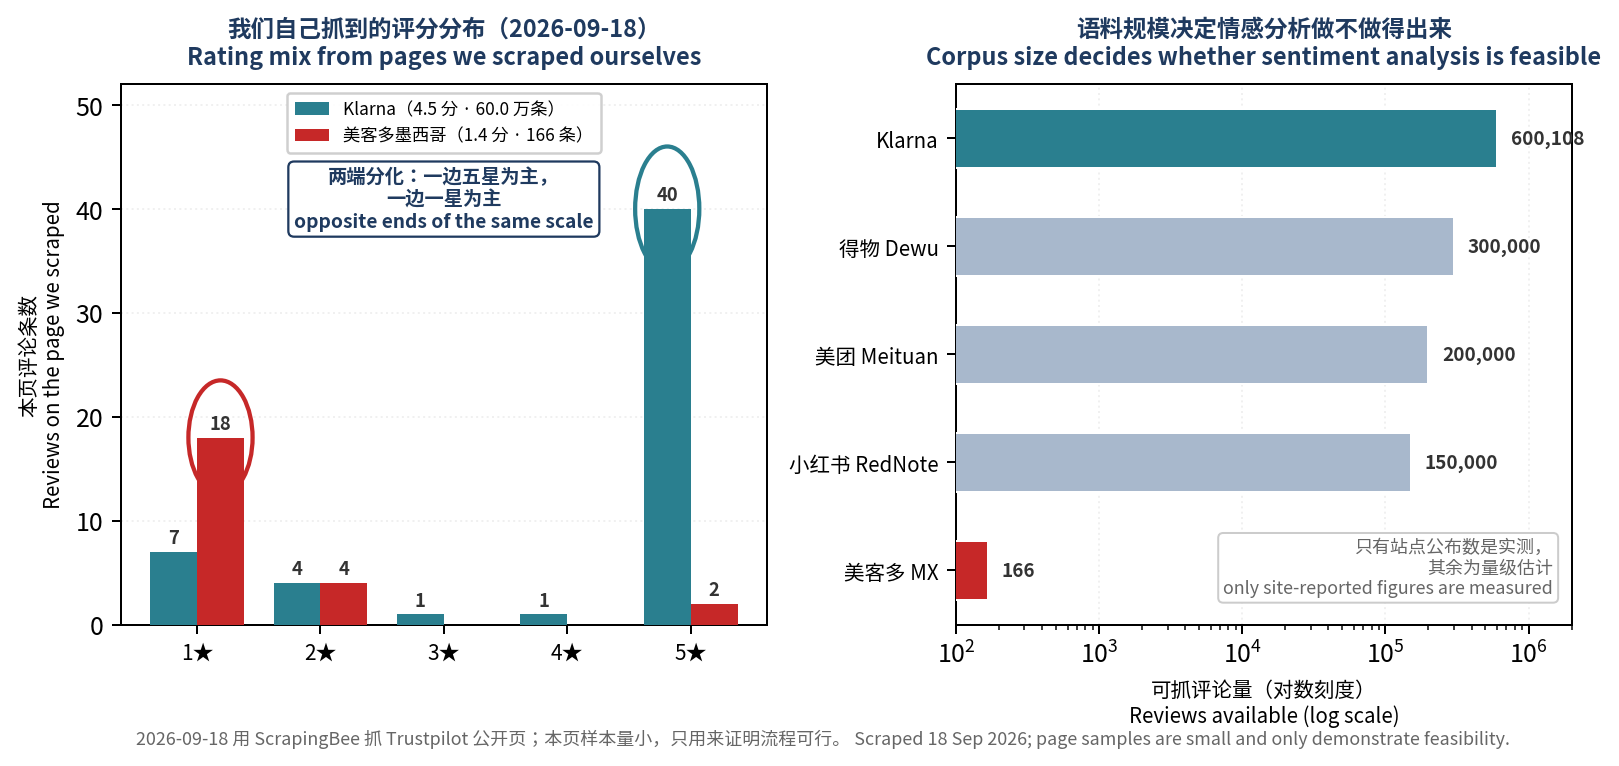
真实数据。2026 年 9 月 18 日,我们用 ScrapingBee 抓取 Trustpilot 公开评论页, 拿到五家公司共 443 条评论,每条都有星级和正文。然后用大语言模型逐条编码:这条是正面还是负面, 以及它在抱怨哪一个方面。
模拟数据。推荐系统那部分的用户和互动记录是模拟的。原因很直接:抓到的评论没有用户 ID, 也没有重复购买记录,没办法拟合真实的协同过滤。所以我们只把商品品质用真实星级分布抽样生成, 用户和互动是合成的。
局限。Trustpilot 是投诉场所,而且只有英文。所以负面比例被系统性高估, 也不能代表这几家公司的本土客群。可比的是同一家公司内部各个方面的相对高低, 以及公司之间的对比,不是绝对水平。
Real: 443 reviews scraped from public Trustpilot pages on 18 Sep 2026, each coded for sentiment and aspect. Simulated: the recommender's users and interactions — the corpus carries no user IDs, so collaborative filtering cannot honestly be fitted to it; only item quality is drawn from the real star distribution. Limitation: Trustpilot is a complaint venue in English only, so negative levels are biased upward and are not representative of domestic customers.
研究方法的四层
Four layers of method — all four already run.
公开财报加宏观数据已完成
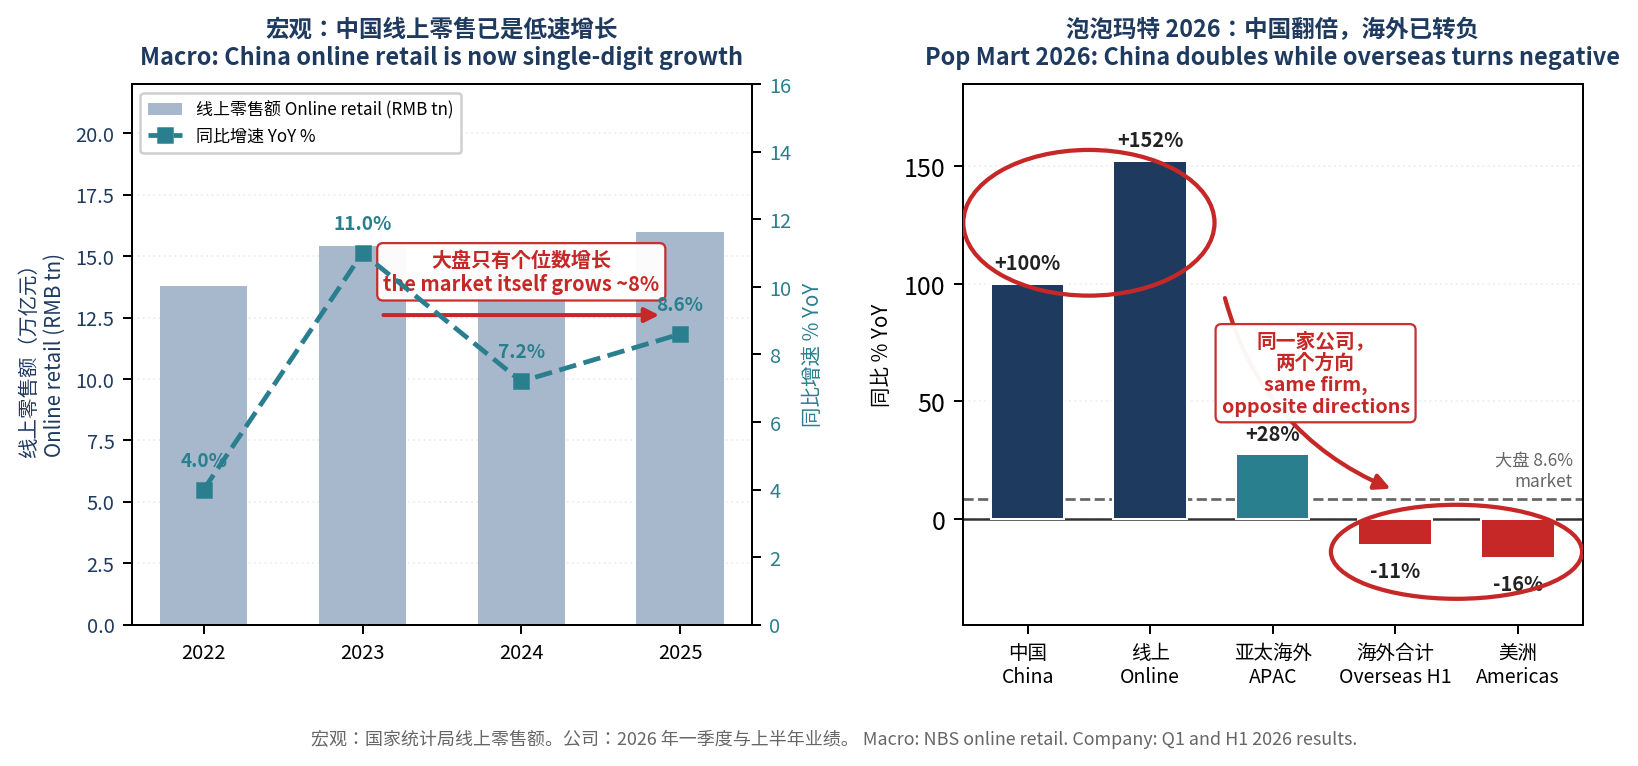
从季报、年报、业绩会记录里抽出 GMV、用户数、支付额、物流成本这些字段,做成时间序列。 再把宏观数据叠在下面:国家统计局的线上零售额、行业规模预测。这样判断一家公司是快过大盘还是慢过大盘, 而不是孤立地看它自己的增长率。
自己抓评论数据已完成
抓公开评论页,得到评分分布和评论原文。这是我们自己建的数据集,不是引用的。 同一份语料还可以按时间切开,看政策或价格战前后的口碑变化。
方面级情感分析已完成
不只报一个平均星级。每条评论都判断它在抱怨什么:配送慢、价格贵、怕假货、退款难、客服差、还是 App 难用。 这样「不满意」就变成了可以拆解的变量。
推荐系统模拟已完成
用真实星级分布生成商品品质,模拟 2000 个用户、600 件商品、跑八轮推荐,比较三种排序方式。 这一层回答课上那个问题:平台到底靠什么把信息流变成成交。抽盒、种草、直播看起来很不一样, 本质都是排序——决定谁先被看到。
发现一:财报说翻倍,评论区说 1.6 星
Finding 1 — the filings and the review page disagree, and what they disagree about matters.
| 公司 | 站点评分 | 我们编码 | 判为负面 | 负面里主要抱怨什么 |
|---|---|---|---|---|
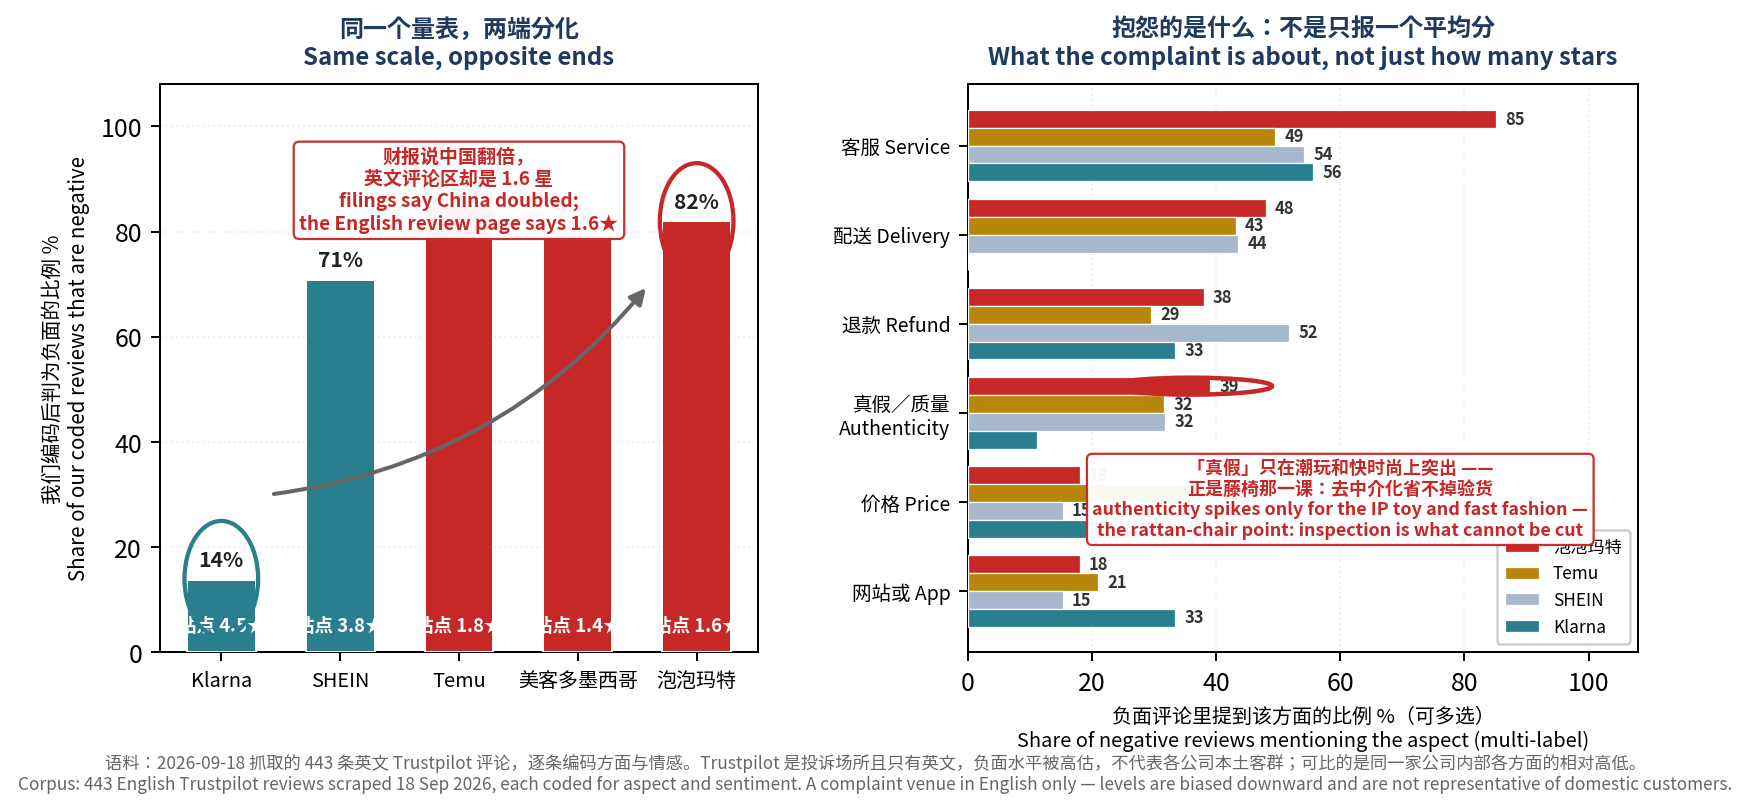
| Klarna | 4.5★ | 65 | 9 | 客服 5 |
| SHEIN(去年做过,仅作对照) | 3.8★ | 120 | 85 | 客服 46、退款 44、配送 37 |
| Temu | 1.8★ | 112 | 95 | 客服 47、配送 41 |
| 美客多墨西哥站 | 1.4★ | 24 | 19 | 客服 10、App 9、退款 9 |
| 泡泡玛特 | 1.6★ | 122 | 100 | 客服 85、配送 48、真假与质量 39 |
为什么这一条值得写进报告
- 泡泡玛特 2026 年一季度财报说中国市场收入翻倍,但它的英文评论页只有 1.6 星,我们编码的 122 条里 100 条是负面的。
- 关键不在「负面多」,而在负面的内容:「真假与质量」这一项只在潮玩和快时尚上突出,Klarna 和美客多几乎不出现。
- 这正好是第一讲藤椅那个例子:去掉中间商能省下交易费用,但省不掉验货。二手市场和假货投诉,就是验货这件事重新长回来的样子。
- 所以我们不是「打算做情感分析」,而是已经拿到一个能对上课堂框架的论点。
发现二:模拟跑出了一个真正的取舍
Finding 2 — the simulation produces a genuine trade-off, not a slogan.
| 排序方式 | 长尾曝光 | 集中度(吉尼) | 买到的品质 | 商品露脸比例 |
|---|---|---|---|---|
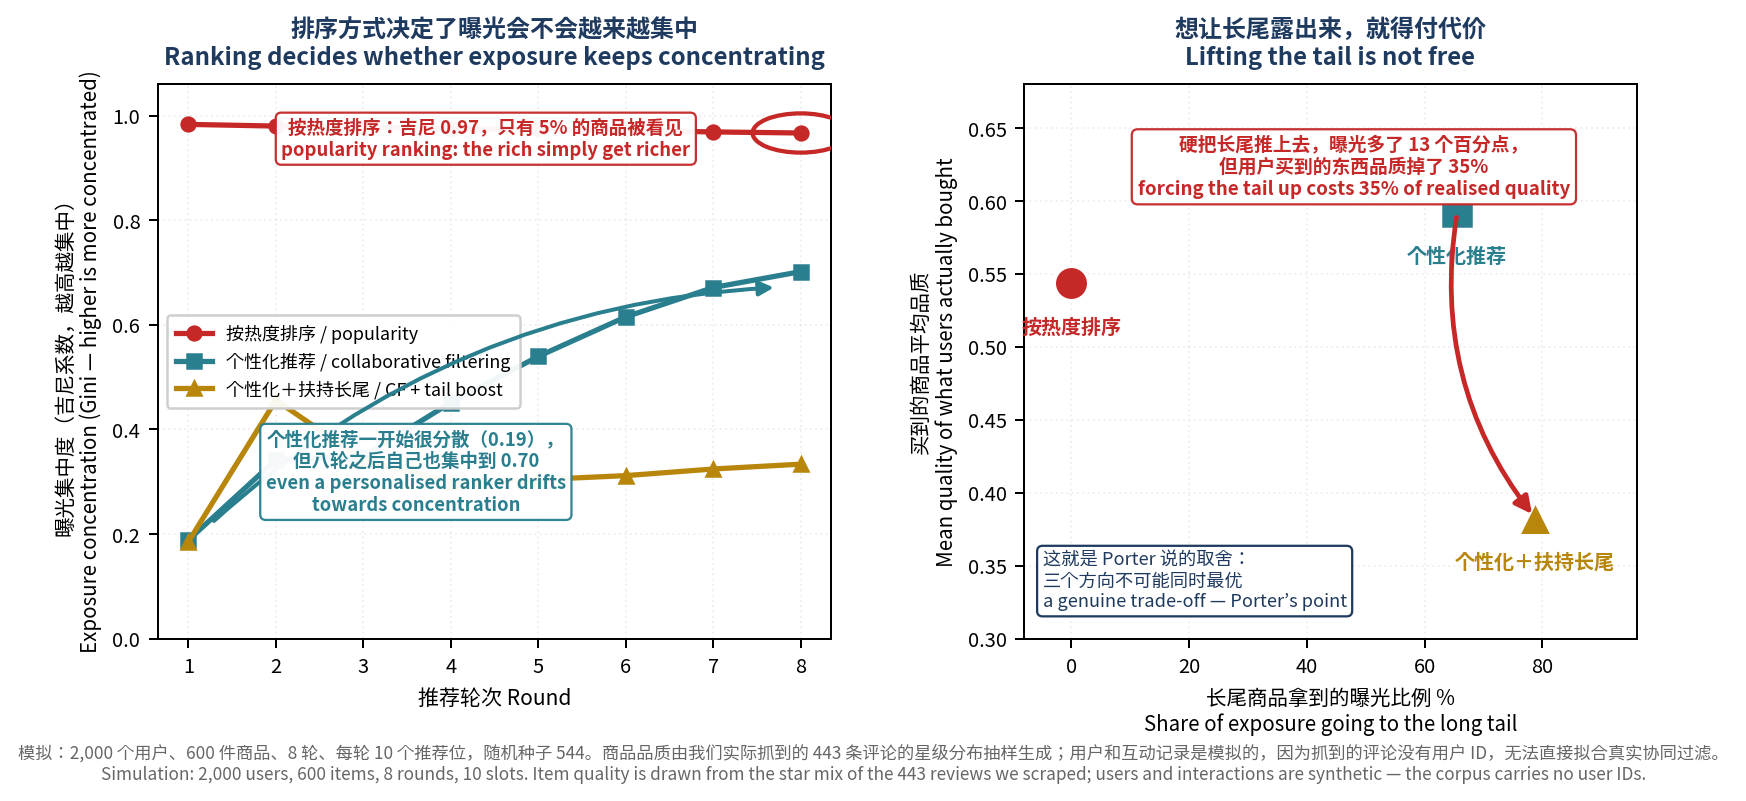
| 按热度排序 | 0.0% | 0.967 | 0.544 | 5.0% |
| 个性化推荐 | 65.6% | 0.702 | 0.592 | 77.2% |
| 个性化+扶持长尾 | 78.8% | 0.334 | 0.383 | 98.0% |
三个结论
- 按热度排序会把曝光集中度推到 0.97,八轮之后只有 5% 的商品被人看过。 热的更热,跟品质完全没关系。
- 个性化推荐一开始吉尼只有 0.19,八轮之后自己漂到 0.70。 没有人刻意让它集中,是反馈回路自己做到的。平台不需要「想」偏心,排序本身就会。
- 硬把长尾推上去,曝光多了 13 个百分点、97% 的商品都露过脸,但用户实际买到的品质掉了 35%。 曝光分散、品质、集中度这三个目标不可能同时最优。
最后这一条正好是 Porter 那篇文章的意思:没有真取舍的改良,终究会被抄走。 我们能用自己的数字把这个取舍量出来,而不是只引一句结论。
公司数字放回宏观背景里看
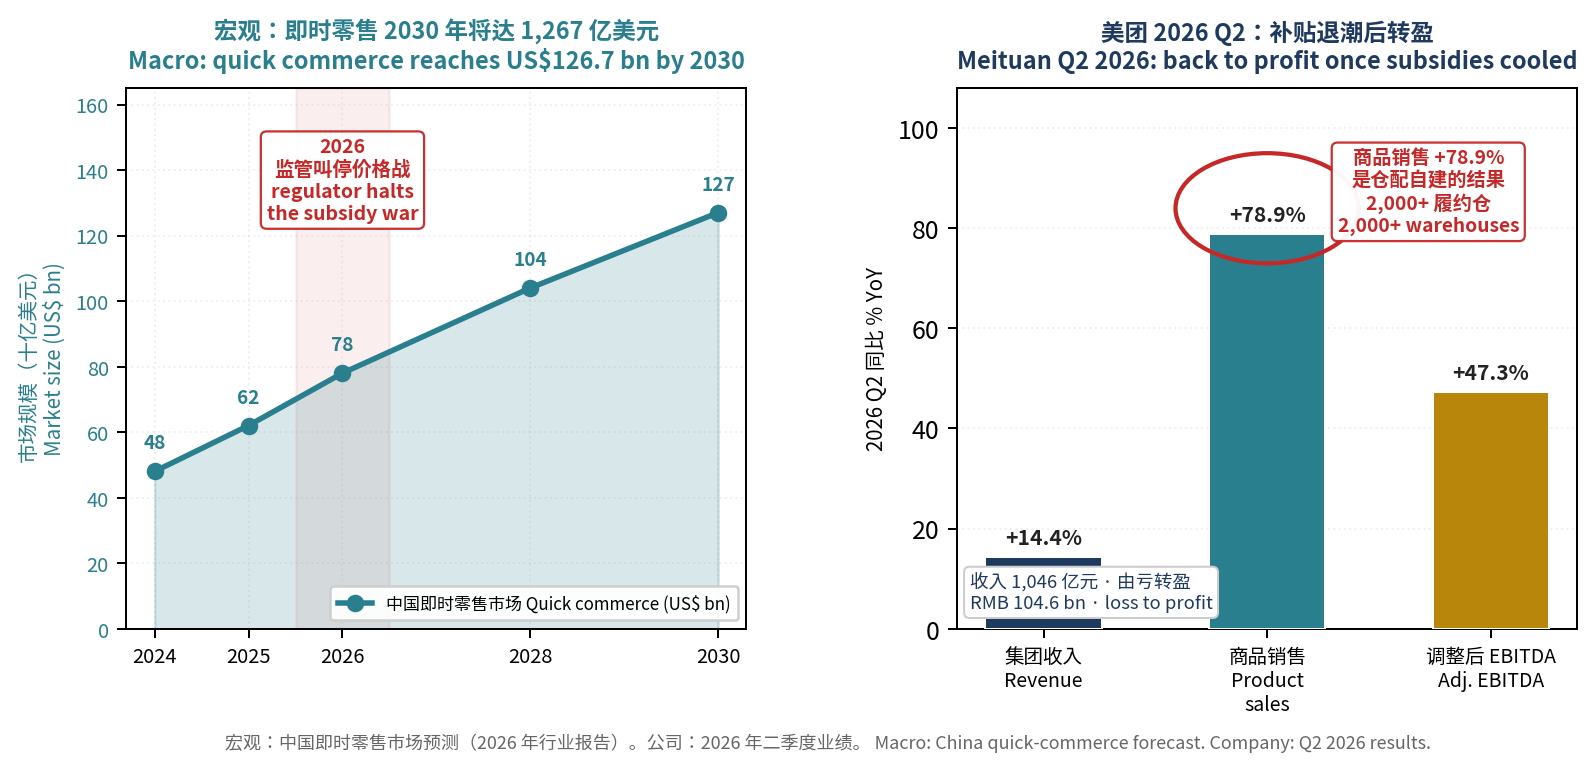
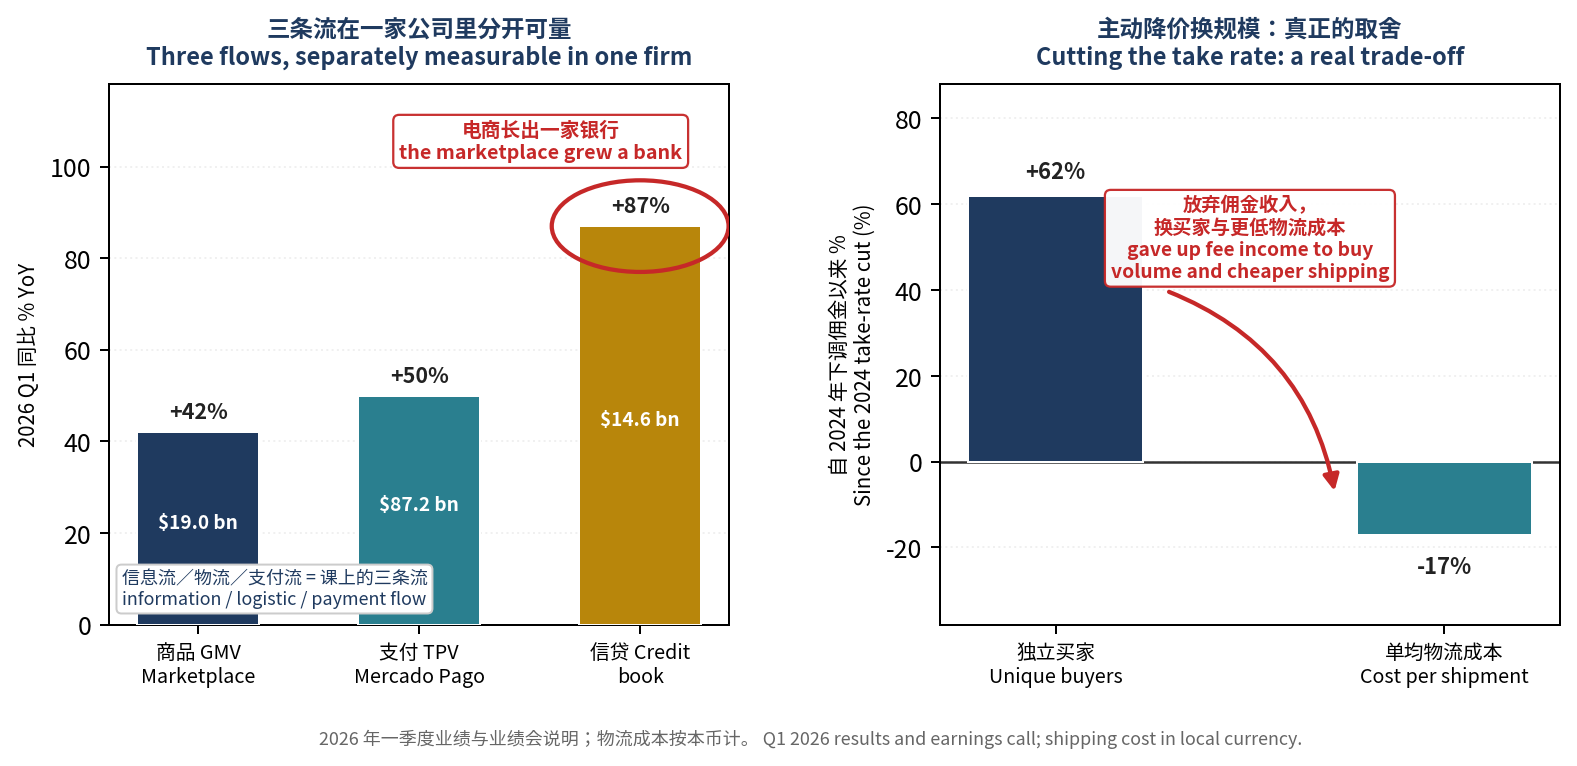
单看一家公司的增长率没有意义。下面每一张图都是左边宏观、右边公司: 先看大盘在做什么,再看这家公司相对大盘是快还是慢。
A growth rate means nothing on its own. Each chart pairs the macro backdrop with the firm.
这些数字可以复现
原始数据和模拟参数都放在这一页旁边,可以直接下载核对:
- sentiment.json — 443 条评论的逐条编码结果(情感、方面、星级)
- recsim.json — 模拟的全部参数、随机种子,以及八轮每一轮的指标
模拟用固定随机种子(544),同样的参数重跑会得到同样的结果。
Raw coded data and the full simulation parameters, including the fixed seed, are downloadable for checking.